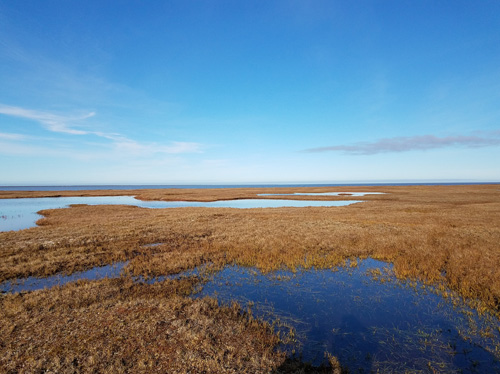
2 May 2024–Permafrost in Utqiaġvik, Alaska, differs from place to place under the surface, ranging from ice rich zones to unfrozen layers in both undisturbed and disturbed tundra, according to a new report discussed at the Seismological Society of America (SSA)’s 2024 Annual Meeting.
Using multiple geophysical techniques to explore this spatial variability, Ahmad Tourei of Colorado School of Mines and colleagues from Penn State and University of Alaska Fairbanks show that infrastructure such as gravel roads and pile foundations are affecting permafrost over the long term. The team observed thawing of ice rich zones and deeper seasonal thaw depths in regions near such infrastructure. This change could lead to thaw-related hazards such as ground subsidence, which can lead to infrastructure damage or development of ponds.
Better maps of permafrost variability like the ones created by Tourei and colleagues are important to understanding the complex structures and fine-scale processes at a site. They also help civil engineers set the parameters for building design and maintenance in polar permafrost. The new findings suggest civil engineers should account for long-term permafrost changes caused by both climate change and existing infrastructure in their designs, Tourei said.
“This can be achieved by applying higher safety factors when designing structures and foundations in permafrost regions to account for these long-term changes and avoid thaw-related hazards,” he added.
The research team used several methods to explore permafrost variability at Utqiaġvik, including analysis of surface waves, electrical resistivity and ground temperature sensing, to develop a more comprehensive understanding of permafrost features.
“For example, while both seismic (vibration) and resistivity (electrical resistance) methods are sensitive to the geological structure of permafrost, seismic methods are particularly sensitive to the permafrost’s stiffness and saturation,” Tourei explained. “In contrast, resistivity methods can provide further details about the permafrost’s salinity and identify unfrozen layers within it.”
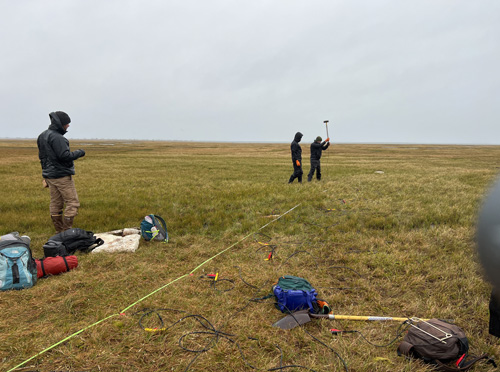
Using seismic data generated by an active source and collected by a geophone array, the team calculated shear wave velocities within ground layers. Seismic waves pass more slowly through more thawed regions and quicker through frozen solid regions, and the researchers found distinct velocity ranges for permafrost layers and the active layer that thaws seasonally.
Comparing these data with permafrost cores taken from the area will help scientists carefully monitor permafrost changes in coastal areas, Tourei said.
He noted that the researchers have now deployed two kilometers of fiber optic cable to expand their surface wave seismic survey using the distributed acoustic sensing (DAS) technique. These data collected over three years will help set benchmarks for how fast permafrost changes along the Alaskan Arctic coast, which could in turn shed light on overall climate warming in the region.